

Twitter Analytics: Find Where You Lose Followers

Find the account habits behind your numbers
Profile Audit reviews your posts, replies, content mix and timing so you can choose what to improve next.
Twitter analytics can give you an impressive reach number while leaving the useful question unanswered: why didn't those views become followers? In one week on my X account, 9,900 impressions led to 59 profile visits and 27 new follows. The middle number tells me more about what to improve than the first one does.
The video below shows the actual X Analytics screens and posts behind this example. This article turns that walkthrough into a repeatable way to read your own numbers.
The three-number follower funnel in Twitter Analytics
Start with impressions → profile visits → new follows for the same date range. Impressions tell you how often posts were seen, visits tell you whether people wanted to learn who wrote them, and follows tell you what happened after they reached your profile. Divide profile visits by impressions for the first check; divide new follows by profile visits for the second. These are useful diagnostic ratios, not a perfect attribution model: a person can see several posts, visit later, or follow without making that exact journey.
In the week shown in the video, 59 ÷ 9,900 = 0.60% for visits per impression, and 27 ÷ 59 = 45.8% for follows per visit. The first transition looks like the larger opportunity. Keep all three numbers visible; a follow count alone cannot tell you whether the problem is reach, post relevance, or your profile.
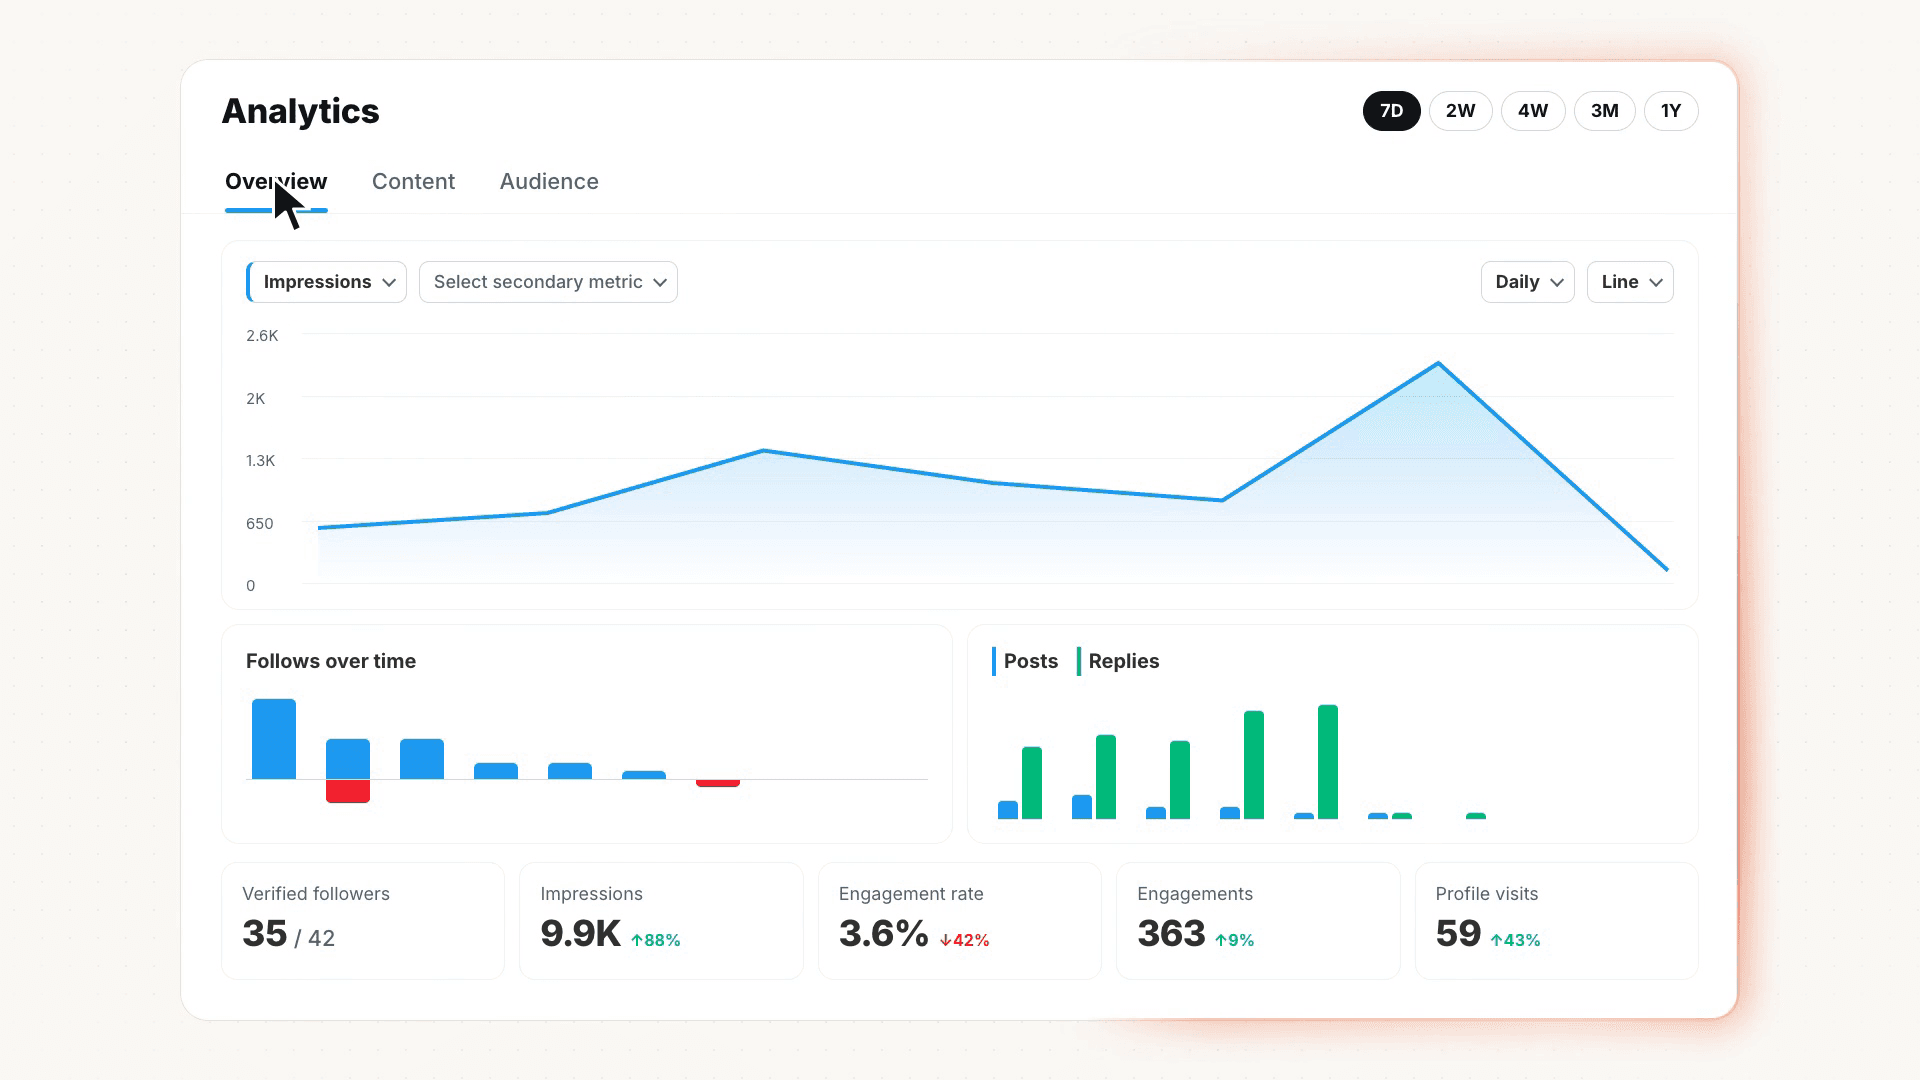
The founder's X Analytics Overview, captured from the video. The screen shows 9.9K impressions and 59 profile visits for this week; the video separately reports 27 new follows.
Check 1: Are impressions turning into profile visits?
Calculate profile visits ÷ impressions × 100. My 0.60% is below the 1% working target I use for my own account in the video; 1% is not a platform benchmark that every account should meet. Compare your rate with your own earlier periods and with posts that reached a similar audience.
Profile analysis
See how your profile really scores
Postory analyzes your X, Threads or Bluesky profile and shows exactly what to fix to get more reach. Audits run on credits, bought in packs.
If reach rises but visits do not, inspect the post itself. Does its opening make a specific promise? Does it contain a result, observation, or story that makes the author worth checking? Generic advice can earn a view without giving anyone a reason to open the profile. For a tighter diagnosis, look at how X impressions are counted before treating every view as a distinct person.
One useful change is to replace a broad tip with a concrete observation from your work, then compare the next set of posts. Another is to leave relevant replies that add your own experience to a discussion. Neither tactic guarantees visits; the point is to test whether more relevant exposure produces more profile curiosity.
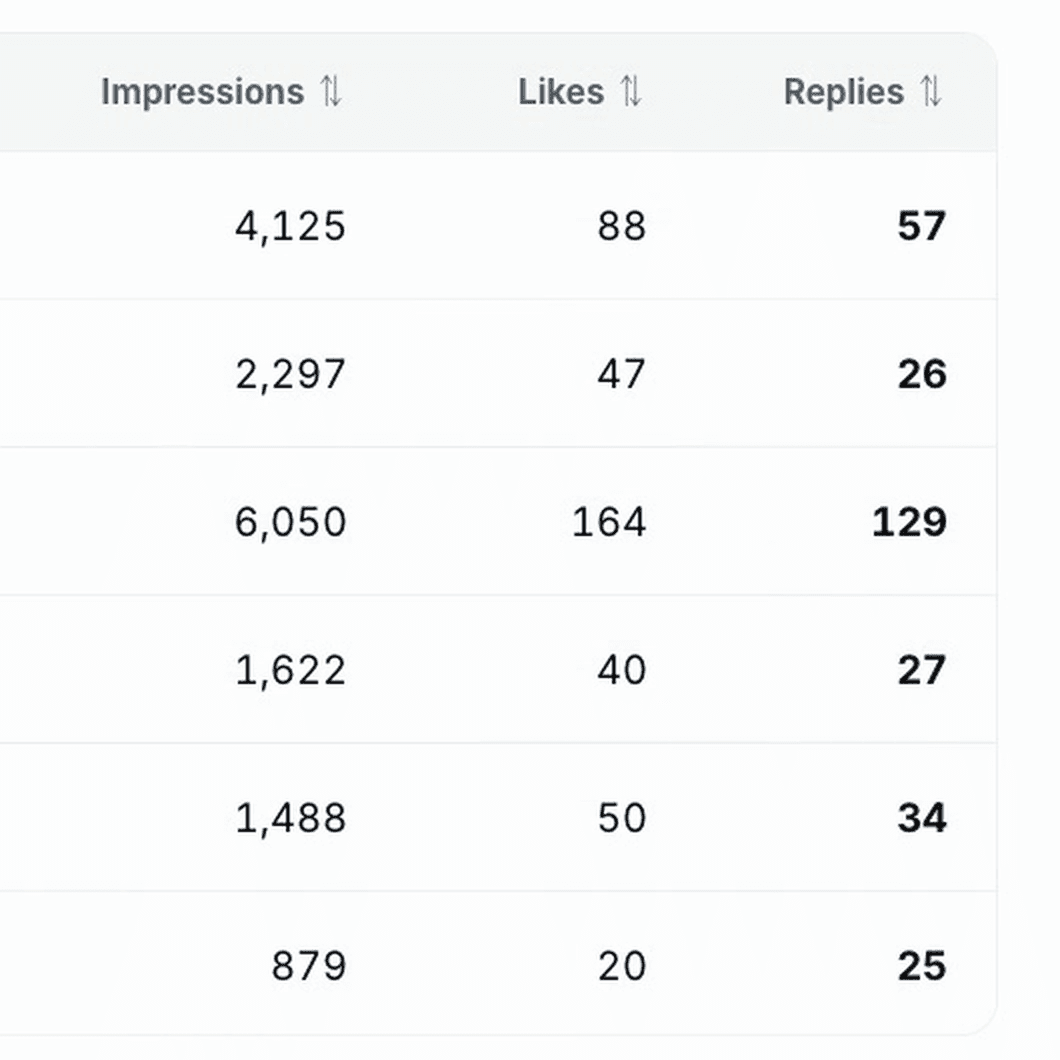
The Content metrics from the video show how post-level impressions and replies differ. Pair the numbers with the corresponding posts in your own dashboard before deciding which topic to repeat.
Check 2: Are profile visits turning into follows?
Calculate new follows ÷ profile visits × 100. Here, 27 follows from 59 visits gives roughly 46%. The video's 10% figure is another personal working target, not a universal standard. With only 59 visits, a handful of different decisions would move the rate sharply. Extend the window before declaring the profile fixed or broken, and remember that aggregate follows may come from routes other than the measured visits.
When this second ratio is weak over a longer period, make the profile answer three questions fast: Who is this for? What will they get by following? Is the latest content consistent with that promise? Rewrite a vague bio, pin a representative post, and check the most recent posts as a visitor would. A viral post outside your usual topic can also attract visitors who were never likely to follow your regular work; the ratio alone cannot distinguish that from a weak bio. For the longer trend, track your follower count alongside what you published.
Why 113K paid impressions did less than 4K organic ones
Reach and attention are different measurements. In the video's two-post example, a promoted post recorded 113,165 impressions and 159 engagements, while an organic post recorded 4,125 impressions and 145 engagements. That is 159 ÷ 113,165 ≈ 0.14% engagement per impression for the paid post, against 145 ÷ 4,125 ≈ 3.5% for the organic post. The paid post had far more exposure but only 14 more engagements.
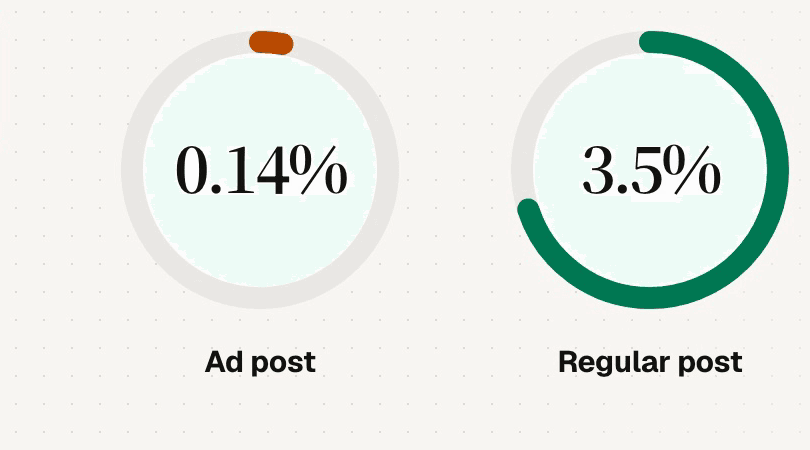
The engagement rates calculated in the video. The underlying posts differ in topic, creative, audience and promotion, so this is a diagnostic example rather than a controlled ad test.
The comparison says these particular impressions produced very different engagement rates. It does not prove that paid distribution is ineffective, that one post was better written, or that X ranked replies by a particular weight. To judge a campaign, compare posts with similar goals and audiences, then inspect the action you actually wanted—profile visits, relevant replies, or follows—not reach alone.
A 10-minute weekly review of Overview, Content and Audience
Use the three views shown in the video as a short review, with one decision at the end:
- Overview: Choose a consistent date range. Record impressions, profile visits and new follows, then calculate both ratios. Notice days with net unfollows, but inspect the surrounding posts before assigning a cause.
- Content: Sort posts by replies and profile interest, not impressions alone. Read the strongest openings and look for a repeated topic or format. One unusual post is a clue; a pattern across several posts is more useful.
- Audience: Note when your followers were active in the heat map. Treat those hours as posting times to try, then compare results across several weeks rather than crediting one good post to its clock time.
Keep a simple line in your notes for each week: date range, impressions, visits, follows, both ratios, and the one change you made. Using the same window prevents a busy day from masquerading as a sustained improvement.
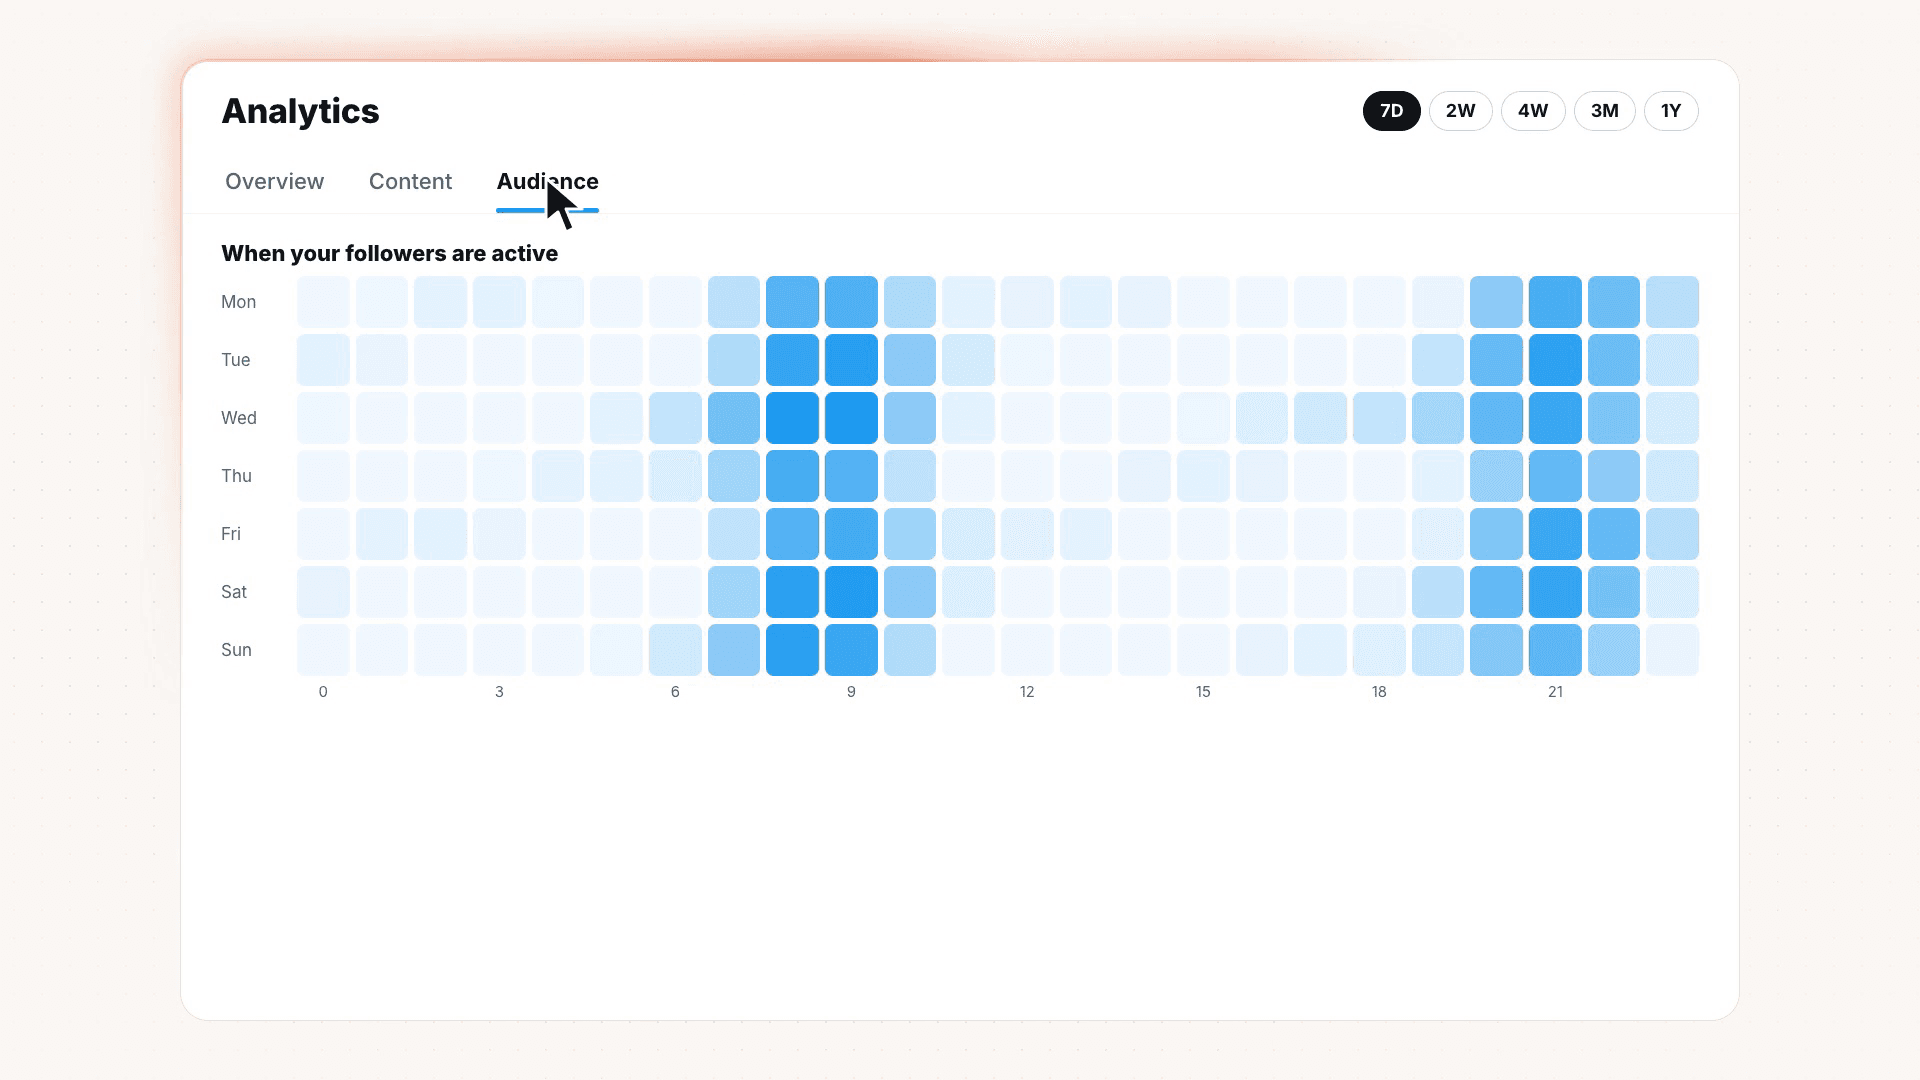
The Audience heat map from the video is a scheduling clue, not a promise that posting in a dark square will cause growth.
What to change next, and what these numbers cannot prove
Change the weakest transition first. A low visit rate suggests testing clearer, more specific posts and replies. A low follow rate suggests checking topic fit, bio and pinned post. If both ratios are stable but reach is small, distribution may deserve attention. Write down the hypothesis, change one thing you can identify, and compare another period of similar length.
These ratios cannot tell you which individual impression caused a follow. They also cannot explain a sudden unfollow, isolate the effect of an ad, or establish a universal good rate from a small sample. Use them to decide where to investigate, then read the posts and the profile that created the numbers.
Start Reviewing Your X Profile with Postory
If the visit-to-follow step keeps underperforming, Postory Profile Audit can help you examine your profile and posting patterns. Bring the two ratios from X Analytics so you know which question you want the audit to answer. Try Postory free and review the evidence before changing your bio or content plan.
FAQ
Q: How do I use Twitter Analytics to find why I am not gaining followers?
Record impressions, profile visits and new follows for the same period. Divide visits by impressions and follows by visits. The weaker transition points you toward the posts or profile to inspect next.
Q: What is a good profile visit rate on X?
There is no single rate that fits every account and audience. The video's author uses 1% as a working target for his own account; your past periods are a better comparison than treating that number as a rule.
Q: What is a good follow rate from profile visits?
The video uses 10% as a working target, but small visit counts make that ratio volatile. Compare similar time windows and check whether the visitors came from posts relevant to your usual topic.
Q: Can I see who viewed my X profile in Analytics?
The screens in the video show an aggregate profile visit count, not a list of visitors. Use that count to compare periods, without assuming it identifies the people who followed.
Q: Do more impressions always mean more followers?
No. Impressions measure exposure. In the two-post example above, the promoted post had many more impressions yet almost the same number of engagements as the organic post. Check visits and follows before calling higher reach a growth win.
Q: How often should I review X Analytics?
A weekly check is enough to record a trend and choose one adjustment. If the visit count is small, use a longer comparison window before drawing a conclusion from the percentages.
Related articles

How to Track Twitter Followers and Follower Count Over Time
Track Twitter followers over time: see any X follower count, what X Analytics shows, and how to log growth, new followers and who left.
Oct 18, 2026

How to Increase X/Twitter Impressions Without Buying Ads
What X impressions actually are, and 10 tactics that get more eyes on your posts — without spending a dollar on ads.
May 27, 2026
Follower to Following Ratio on X: What's Good in 2026
Your follower to following ratio on X, explained: how to work it out, what counts as a good one, where X uses it, and how to fix a bad one.
Oct 18, 2026