
Social Media KPIs: Which Numbers Actually Matter (And Which Don't)
Impressions and follower counts look great in a screenshot but don't predict revenue. Track five KPIs instead — engagement rate by impressions, profile-visit conversion, click-through to a page you own, reply quality, and downstream conversions — and stop reporting the eight vanity metrics that just pad the slide.
You learn how to create content for social media, you ship it, and your monthly report is a wall of impression counts going up and to the right. Then a stakeholder asks the only question that matters — "so what did this do for the business?" — and the wall of numbers has no answer. The problem isn't your content. It's that you're measuring the wrong things. This post breaks down the five KPIs that connect social to revenue and the eight vanity metrics quietly wasting your reporting time.
Why Does Reporting on Impressions Alone Fail?
Reporting on impressions alone fails because an impression only proves your post entered a feed — not that anyone read it, cared, or did anything afterward. An impression is counted the moment a post appears on screen, regardless of interaction. So a number that climbs every month can coexist with flat clicks, flat signups, and flat revenue, which is exactly why stakeholders stop trusting social reports. The trap is that impressions are the easiest metric to grow: post more, post at peak times, add a trending tag, and the count rises without your content improving at all. Marketers fall into this because followers and reach feel like progress, but a metric only becomes a KPI when it's tied to a business objective. Impressions are a denominator — useful for calculating rates — not a destination. Treat them as raw fuel for better ratios, never as the headline number on the slide.
What Are the 5 Social Media KPIs That Map to Revenue?
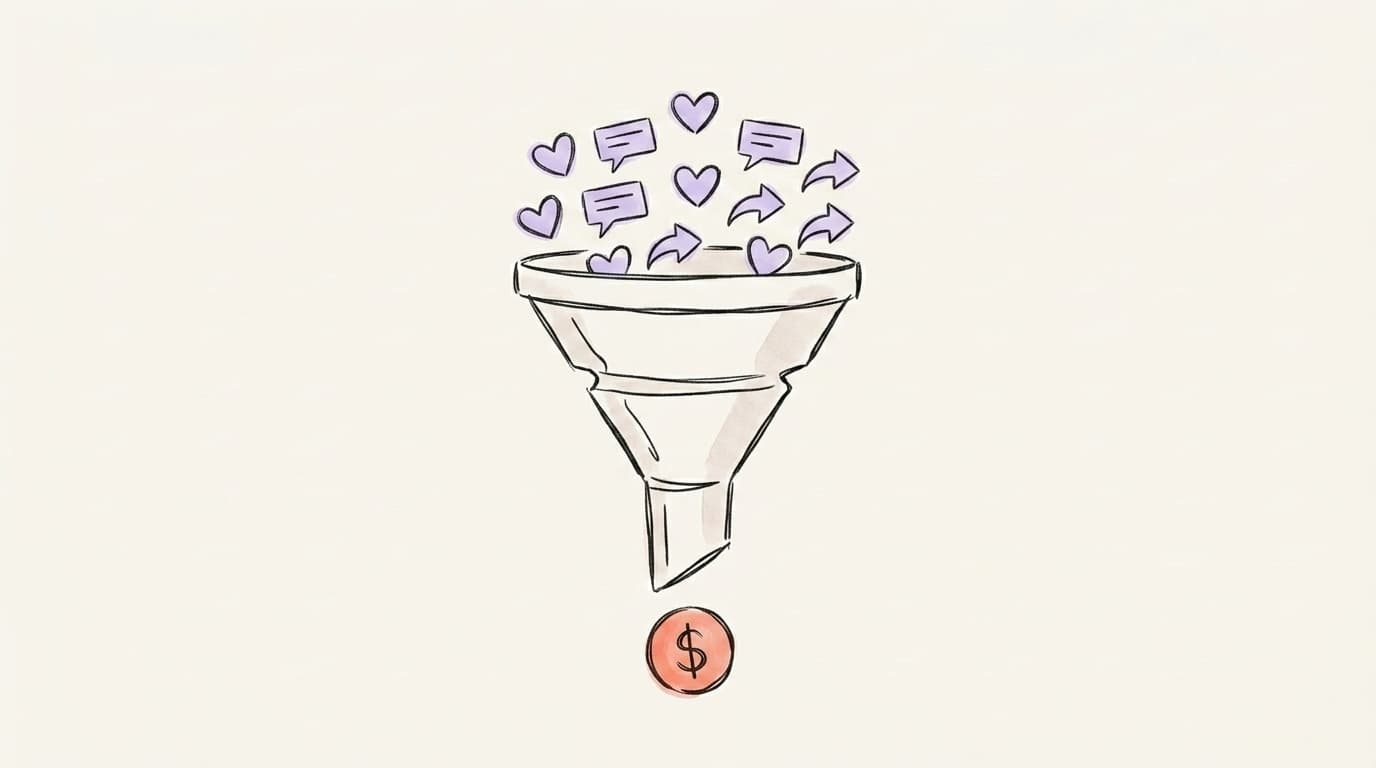
The five social media KPIs that map to revenue are engagement rate by impressions, profile-visit-to-follow conversion, click-through to a property you own, reply quality, and the downstream conversions those clicks produce. Together they form a funnel: a post earns engagement, engagement drives profile visits, visits convert to follows or clicks, clicks land on your site, and your site converts visitors into signups or sales. Each KPI measures a real handoff between stages, so when revenue dips you can see exactly which handoff broke instead of staring at a flat impressions chart. The rule most teams miss: pick a focused handful of KPIs and optimize for those, not fifteen. More metrics don't mean more insight — they mean a slower decision.
Here's a clear walkthrough of how to group metrics by goal — engagement, awareness, and ROI — from Sprout Social:
Free profile analysis
See how your profile really scores
Postory analyzes your X, Threads, or LinkedIn profile and shows exactly what to fix to get more reach.
How Do You Measure Engagement Rate the Right Way?
You measure engagement rate the right way by dividing meaningful interactions by impressions — not by followers — and weighting comments, saves, and shares above likes. Engagement rate by impressions tells you what share of people who actually saw the post chose to act on it, which is far more honest than a follower-based ratio that flatters small accounts and punishes large ones. This is also why LinkedIn reports engagement rate by impressions, landing at a 2026 median of about 5.2% — interactions divided by how many times the post surfaced in feeds. Benchmarks vary wildly by platform: Socialinsider's analysis of 70 million posts puts 2026 medians at roughly 3.7% on TikTok, 0.48% on Instagram, 0.15% on Facebook, and 0.12% on X. Those four are calculated against followers, so don't line them up next to LinkedIn's impression-based 5.2% and conclude LinkedIn is ten times more engaging — that gap is a methodology artifact, not a real difference. The takeaway isn't the exact figure — it's the formula, and that you compare platforms only when they share one.
A few rules to keep your engagement rate honest:
- Use impressions as the denominator, not followers. Follower-based rates make a 200-follower account look like a superstar and a 200,000-follower account look broken.
- Weight by effort. A comment or save costs the reader far more than a like, and signals genuine interest. Track them separately so a wall of hollow likes can't hide weak content.
- Compare like with like. Methodologies differ so much that the same platform and year can differ by an order of magnitude between tools. Pick one formula and never switch it mid-report.
If you want to go deeper on the impressions side of this equation, our guide on what LinkedIn impressions are breaks down exactly what counts and what doesn't.
What Do Profile Visits and Follower Conversion Tell You?
Profile visits and follower conversion tell you whether a post made anyone curious enough to investigate you — the bridge between a single post performing and your account actually growing. A profile visit is logged when someone taps through to your profile after seeing your content, which means your post did its job: it created enough interest to pull the reader out of the feed. The follow-through metric — what share of those visitors hit "follow" — is your profile-conversion rate, and it's one of the most diagnostic numbers you can track. High visits but low follows almost always points at the profile itself: a weak bio, an unclear value proposition, or a feed that doesn't deliver on the hook that earned the visit. You can fix that without changing your content strategy at all, which is why this KPI is so actionable. Watch the ratio over time, not the raw visit count.
Why Does Click-Through to a Property You Own Matter Most?
Click-through to a property you own matters most because it's the first KPI on this list where social media stops being rented attention and becomes traffic you control. A like lives on the platform; a click to your site, newsletter, or signup page moves the relationship somewhere an algorithm can't throttle overnight. For organic posts, a click-through rate of 3-5% on links signals genuinely strong, relevant content — and notably, organic CTRs often beat the 0.44%-0.65% benchmark for LinkedIn ads. The catch is attribution: you can't connect a click to a conversion unless you tag the link. Sprout recommends UTM parameters — a short code appended to every URL you share — so Google Analytics shows exactly which channel, post, or campaign sent the traffic that converted. Without UTMs, your most important KPI is invisible.
To make click-through a habit rather than an afterthought, do this:
- Add a UTM to every shared link. Tag the source (linkedin, x, threads), medium (organic, social), and campaign so each click is traceable.
- Send clicks somewhere that converts. A bare homepage wastes the click. Point links at a focused landing page, a lead magnet, or a signup flow.
- Watch CTR by content type. If how-to posts out-click hot takes 3:1, you've just found what to make more of.
If clicks are your bottleneck, our breakdown of how to increase social media engagement covers the hooks and formats that earn the tap in the first place.
How Do You Measure Reply Quality (Not Just Reply Count)?
You measure reply quality by reading what people actually say back, then sorting replies into buckets — questions, objections, praise, tags of other people, and one-word noise — instead of counting them as a single lump. Reply count is a vanity metric in disguise: fifty "🔥" replies and fifty "wait, how does this handle X?" replies produce the same number but mean completely different things. The second batch is a goldmine — it tells you what your audience doesn't understand yet, which objections block a purchase, and what to make next. Comments and saves signal genuine connection far more than likes, because they take real effort — which is also why platform algorithms tend to weigh them more heavily. A practical scoring approach: tag each reply as high-intent (a question, a "where do I buy this", a tag of a colleague), neutral (generic praise), or noise (emoji-only). Track the share of high-intent replies per post. When that share climbs, your content is starting conversations that lead somewhere — the entire point of being on social.

Which 8 Vanity Metrics Should You Stop Reporting?
The eight vanity metrics to stop reporting are the numbers that go up reliably without telling you anything actionable about revenue, retention, or what to create next. They're not worthless — some make fine diagnostic inputs — but none belong as a headline KPI on a report, because each can grow while the business stays flat. The test is simple: if a number rises, does it change a decision you'd make tomorrow? If not, demote it. Here are the eight that most often masquerade as success:
- Total follower count. A lagging vanity number; follower conversion rate is the KPI, the raw total is not.
- Raw impressions. Useful only as a denominator for engagement rate — never as the win itself.
- Total likes. The lowest-effort interaction there is. Easy to farm, weak as a signal.
- Reach (in isolation). Tells you how far a post spread, not whether spreading helped.
- Post volume. "We published 40 posts" measures activity, not outcomes.
- Video views (counted on autoplay). A sub-second autoplay view isn't attention. Watch-through rate is.
- Hashtag counts and "trending" placements. Visibility theater that rarely survives to a click.
- Follower growth without source. Growth you can't attribute to a campaign or post can't be repeated on purpose.
Drop these from the headline of your report. Keep them, at most, as supporting context two layers down — and only when they explain why a real KPI moved.
Start Measuring What Matters With Postory
Knowing the five KPIs is half the job. Once you know which numbers matter, deciding what to post stops being a guessing game — you make more of what moves engagement rate, profile conversion, and clicks, and less of what just pads the impression count. The other half is actually pulling those KPIs consistently across X, LinkedIn, and Threads without rebuilding a spreadsheet every Monday — which is where most teams quietly give up and fall back to screenshotting impressions.
Postory's social media analyzer scores your X, Threads, or LinkedIn profile across consistency, content mix, profile, and timing, then hands you ranked fixes and your best-performing post template — so you can see which of these KPIs is your real bottleneck in under 90 seconds. Postory tracks the five KPIs across X, LinkedIn, and Threads automatically, so the numbers that map to revenue are the ones you see first.
Try Postory free — analyze your profile and find the one KPI holding your account back.
FAQ
Q: What is the difference between a metric and a KPI?
A metric is any number you can measure — impressions, likes, reach. A KPI is a metric you've tied to a specific business goal, like profile-visit conversion mapped to follower growth. Every KPI is a metric, but most metrics never become KPIs. The distinction is whether the number changes a decision.
Q: Is follower count a vanity metric?
Mostly, yes. Raw follower count is a lagging number that can climb from a single viral post or paid promotion without improving engagement or revenue. The actionable version is your follower-conversion rate — what share of profile visitors actually follow — which tells you whether your profile earns the follow.
Q: How do I measure social media ROI?
Tag every shared link with UTM parameters so Google Analytics attributes site traffic and conversions back to specific posts and channels. Then connect those conversions to revenue. ROI is impossible to prove from in-platform metrics alone — the click-to-conversion handoff has to be tracked on a property you own.
Q: What is a good engagement rate in 2026?
It depends entirely on the platform and how you calculate it. Using Socialinsider's follower-based 2026 medians, roughly 3.7% on TikTok is typical, versus around 0.48% on Instagram and 0.12% on X. LinkedIn's roughly 5.2% looks far higher, but it's measured against impressions rather than followers — so it isn't comparable to those figures, and the apparent gap is a methodology difference, not a sign LinkedIn is more engaging. Always compare against your own platform's benchmark calculated the same way, not a cross-platform average.
Q: Should I report engagement rate by followers or by impressions?
By impressions, in almost every case. A follower-based rate inflates small accounts and deflates large ones because the denominator doesn't reflect who actually saw the post. Engagement rate by impressions answers the more useful question: of the people reached, how many acted?
Q: How many social media KPIs should I track?
A focused handful. You can monitor more metrics for diagnostic context, but optimizing for too many spreads your attention thin and slows decisions. Pick the few that map most directly to your goal and make those the headline of every report.
Q: What are LinkedIn impressions and do they matter?
A LinkedIn impression is counted each time your post appears in someone's feed, whether or not they interact. They matter as the denominator for engagement rate — but not as a standalone success metric. A rising impression count with flat clicks just means more people scrolled past you.
Related articles

Threads Analytics: How to Track What's Actually Working
Native Threads Insights show you a lot — and hide a few things that matter. Here's how to read your data, find the gaps, and figure out who liked your post.
May 20, 2026

Threads vs. Twitter/X: Which Should Creators Post On in 2026?
Threads vs Twitter/X in 2026 — audience, algorithm, monetization, and the cross-posting workflow creators actually use.
May 16, 2026

What Are LinkedIn Impressions? A Clear Guide for Creators
LinkedIn impressions explained in plain English — what counts, what doesn't, how they differ from views and reach, and how to get more of them.
Apr 22, 2026